
We’ve already seen very good money made in the gold sector. Gold broke out first. Now copper is moving up and threatening to rally into historic territory. Lithium stocks are moving too. And now what do we see?
Yesterday we tabled the idea that commodities are beginning to rumble. This is perfectly in accord with investment theory.
Late in any business cycle it’s commodities that are usually the ones to move.
We’ve already seen very good money made in the gold sector. Gold broke out first. Now copper is moving up and threatening to rally into historic territory.
Lithium stocks are moving too.
And now what do we see?
Iron ore is back over US$100. Don’t misunderstand the significance of this.
Markets are all about positioning. It’s not what happens so much, but what was priced in beforehand…and how events end up playing out.
I can tell you directly that every investment bank that I’m aware of had iron ore falling toward US$80 by the end of the year.
You probably know the reasons. Weak Chinese property. Too much supply. The West African project Simandou getting closer.
Naturally, this bearish outlook gets built into the iron ore shares.
Now, this is the type of situation I LOVE.
Let’s walk through the implications. The market has priced in about US$80 per tonne into iron shares over the next 12 months.
Let’s use producer Champion Iron ($CIA) as our proxy here. It’s down 15% over the year.
However, in the last month it’s up 25%, and rising alongside the iron ore price.
See here…
|
|
|
Source: Market Index |
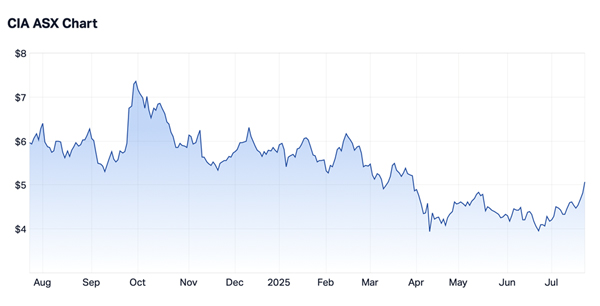
That recent rally is the market readjusting as the outlook around iron changes from previous expectations.
Why?
The Australian Financial Review reports…
“China’s plan to build a mega dam in Tibet has revived hopes that Beijing is targeting steel-intensive projects to drive growth, triggering a spike in iron ore trades as the market positions for more stimulus measures in the weeks ahead.”
Michael Howell over at Capital Wars also adds…
“Chinese policy makers have ploughed in a whopping RMB10 trillion (circa US$1½ trillion in seasonally-adjusted terms) over the past six months. Recall, whereas the US Fed has most influence over World financial markets, the PBoC greatly influences World commodity prices, because of China’s large economic footprint.”
China is stimulating and it’s lifting the outlook for natural resources. You can position in the slipstream of this.
Now, I can’t guarantee the recent rally in these sectors will keep going. They could fizzle out.
However, don’t forget that the big iron ore producers make very good margins.

Any lift over US$100 drops straight to the bottom line for stocks like Fortescue ($FMG) and Rio Tinto ($RIO).
This recent rally is also improving the debt profile of Mineral Resources ($MIN).
(And, of course, it’s improving the revenue of the Australian government).
Iron ore only needs to hold the line at US$100 for this angle to work. The longer it stays elevated the more pressure builds for the associated shares to keep lifting.
You also have less risk than 12 months ago because all of them are down from their highs.
Analyst Robert Rennie warns that China has high inventory levels. It can shut down any rally by drawing these down. This is a risk to factor in.
Hmm. It’s curious to note that China also has very high oil inventories too. They could collapse the price of oil if they stopped importing as well.
Is China stockpiling aggressively for a reason? Your guess is as good as mine.
But it makes it all pretty simple. Commodities are entirely dependent on China.
If China keeps buying, there’s money to be made. If China doesn’t, watch out below.
Right now, I think it’s a risk worth taking.
Best wishes,
 |
Callum Newman,
Editor, Small-Cap Systems and Australian Small-Cap Investigator
|
|
|
Source: Tradingview |
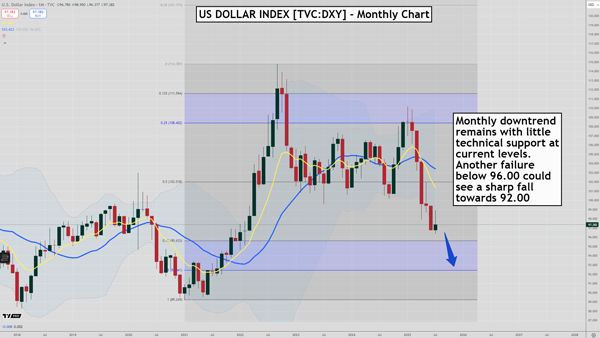
As we head towards Trumps 1 August D-Day for tariffs, investors appear to be voting with their feet as the US Dollar Index [TVC:DXY] starts to sell off sharply again.
The chart above shows you the monthly chart which gets rid of much noise.
The current downtrend in the US dollar started in January and you can see the steady march downward of red bars since then.
The long-term downtrend was confirmed in April, and despite being oversold in the short-term the selling pressure remains.
Another attempt at the low of the whole move at 96.37 could ignite the next wave of selling. There is little technical support at current levels which increases the odds of continuation.
The next major level of support for the US dollar is between 92.50-95.50. That’s the buy zone of a major wave from 2021-2022.
Buit there is no guarantee that we will see a major low form in that area. If investors decide the US dollar is on a one way trip down and the trade war gets nasty again we may see the US dollar falling far more than most expect.
Regards,
 |
Murray Dawes,
Editor, Retirement Trader

All advice is general advice and has not taken into account your personal circumstances.
Please seek independent financial advice regarding your own situation, or if in doubt about the suitability of an investment.

Callum Newman is a real student of the markets. He’s been studying, writing about, and investing for more than 15 years. Between 2014 and 2016, he was mentored by the preeminent economist and author Phillip J Anderson. In 2015, he created The Newman Show Podcast, tapping into his network of contacts, including investing legend Jim Rogers, plus best-selling authors Jim Rickards, George Friedman, and Richard Maybury. He also launched Money Morning Trader, the popular service profiling the hottest stocks on the ASX each trading day.
Today, he helms the ultra-fast-paced stock trading service Small-Cap Systems and small-cap advisory Australian Small-Cap Investigator.