In part two of this series, we delve into the unique investment characteristics of royalty companies, how they can fit into investor portfolios, and their potential to increase income and improve overall risk adjusted returns for investors.
Why include royalty companies in your portfolio?
As we discussed in part one, royalty companies are often considered resilient, capital efficient business. Since they often own the rights to future revenue streams rather than operating businesses directly, royalty companies typically offer:
- Protection in inflationary environments
- Attractive underlying fundamentals and strong cash flow growth
- Lower correlation to traditional asset classes and diversification benefits
- Potential for differentiated, attractive returns compared to traditional asset classes
Protection in inflationary environments
Royalty revenues are often linked to the sale prices of final goods and services, meaning they can benefit from rising prices (inflation). At the same time, royalty companies remain insulated from the direct operational risks and rising input costs of manufacturing, mining and distribution. Hence they can benefit from both rising prices and are less exposed to input cost inflation, providing protection in inflationary environments.
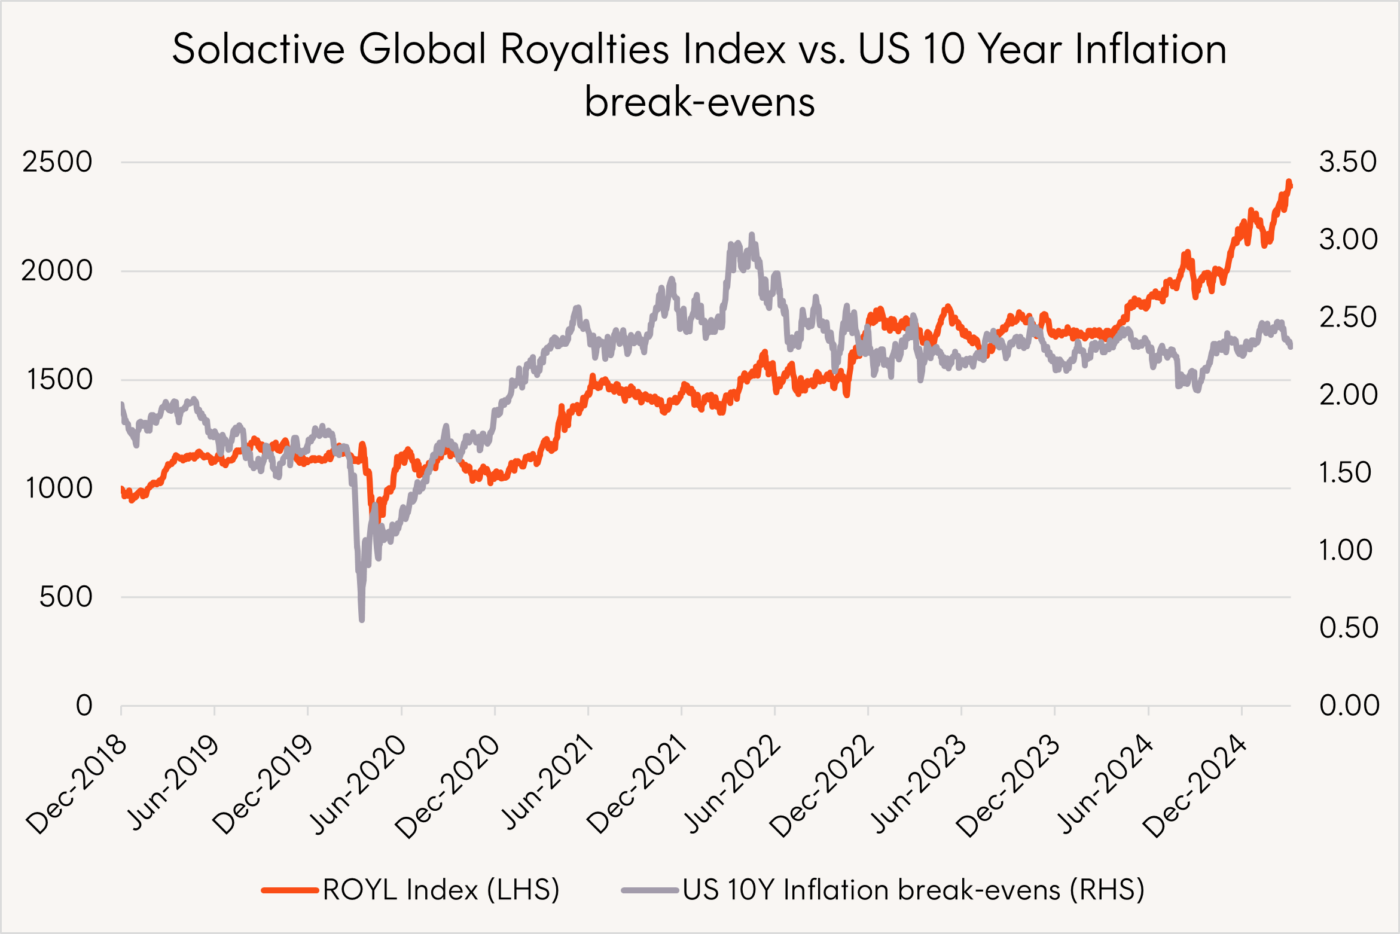
As can be seen in the chart below,
ROYL
Global Royalties ETF
index has exhibited a high correlation with US inflation breakevens, which is a widely used market-based measure of inflation expectations as reflected in the spreads between US Treasury bonds and US Treasury Inflation-Protected Securities (TIPS) of the same maturity.

Source: Bloomberg. From November 2018 to June 2025. ROYL’s index is the Solactive Global Royalties Index. Chart denotes index performance and does not include ROYL’s management fee and cost of 0.69% p.a. You cannot invest directly in an index. Past performance is not an indicator of future performance.
Attractive fundamentals
Given their low capital and labour requirements, royalty companies often enjoy stable and scalable business models. They tend to exhibit higher gross margins and stronger return on capital, making them attractive from a fundamental basis relative to other global companies as represented by the MSCI World Index.
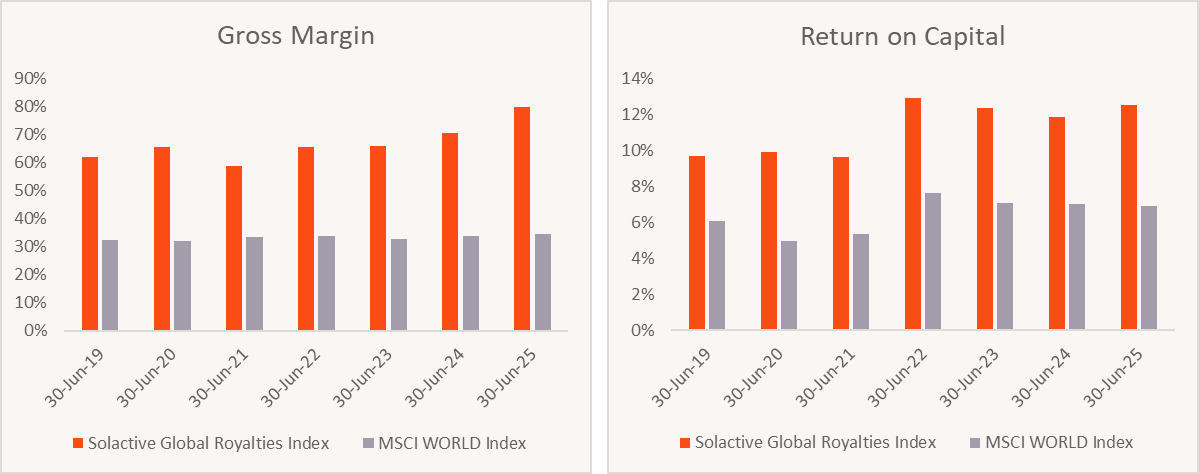
Source: Bloomberg. 30 June 2019 to 30 June 2025.
For the reasons mentioned above, while they may operate in traditionally ‘cyclical’ sectors, as royalty companies grow and diversify, their operating margins can become more stable than the underlying businesses their royalty streams are derived from.
For example, below we compare the stability of EBITDA1 margins of the S&P Biotechnology Select Industry Index, a well-diversified representative index comprising of over 100 biotechnology companies, to Genmab A/S the largest biotech royalty company in ROYL’s index. We can see Genmab A/S has been able to achieve not only higher, but more stable EBITDA margins over time.
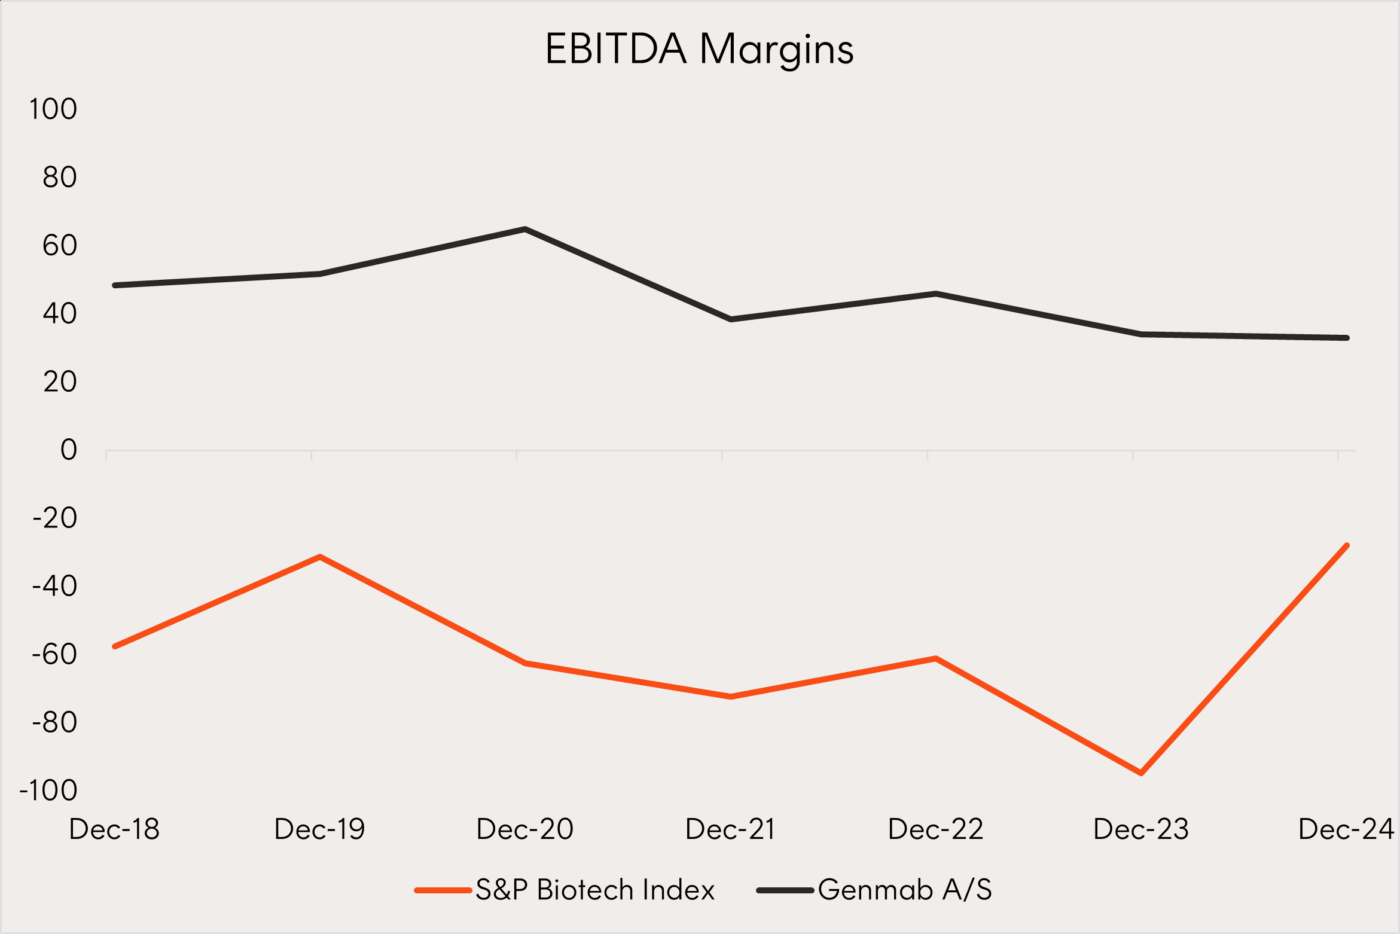
Source: Bloomberg. As at June 2025.
Stability can be measured by a metric known as the coefficient of variation (CV).
The table below compares the CV for EBITDA margin of the 3 largest industries in ROYL as represented by a broad equity index of the underlying industry, against the largest royalty company held in ROYL for each industry.
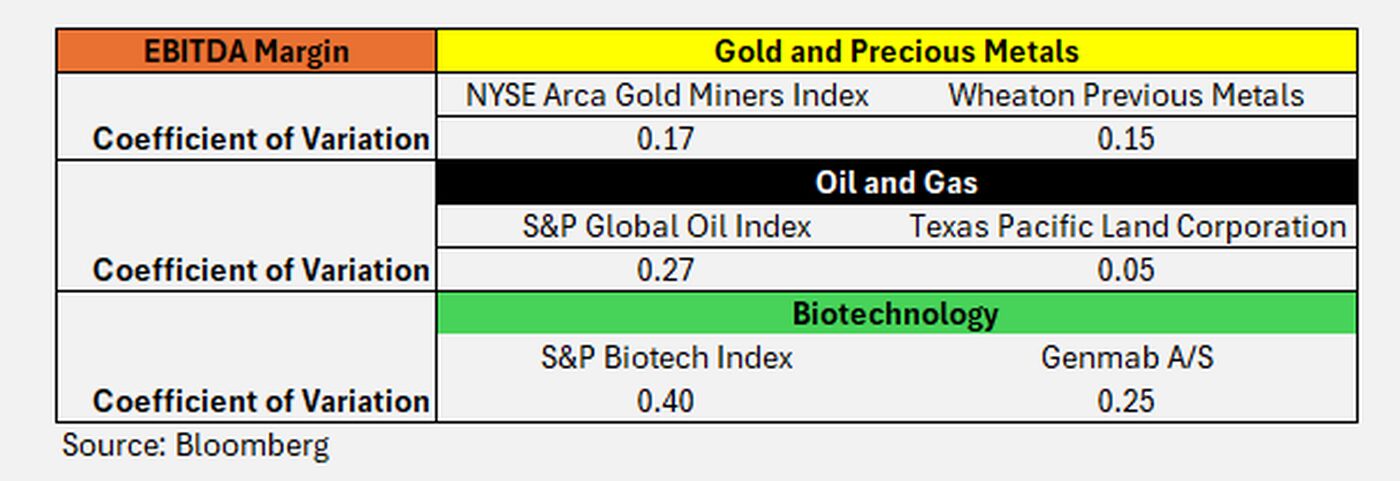
Source: Bloomberg, as at 31 July 2025. Coefficient of variation (CV) – a standardised measure of dispersion calculated as the standard deviation divided by the average from each dataset, the lower the CV the less the dispersion
In each instance the royalty company has a lower CV meaning a higher stability of operating margins.
The companies in ROYL have demonstrated robust, resilient cash flow streams underpinned by long-life underlying assets such as mines or licensing agreements for drug treatments. These durable cash flows have been growing faster than the broader market, businesses capable of generating strong levels of cashflows are less dependent on external capital markets for funding, positioning them more favourably to pursue and capitalise on growth opportunities.
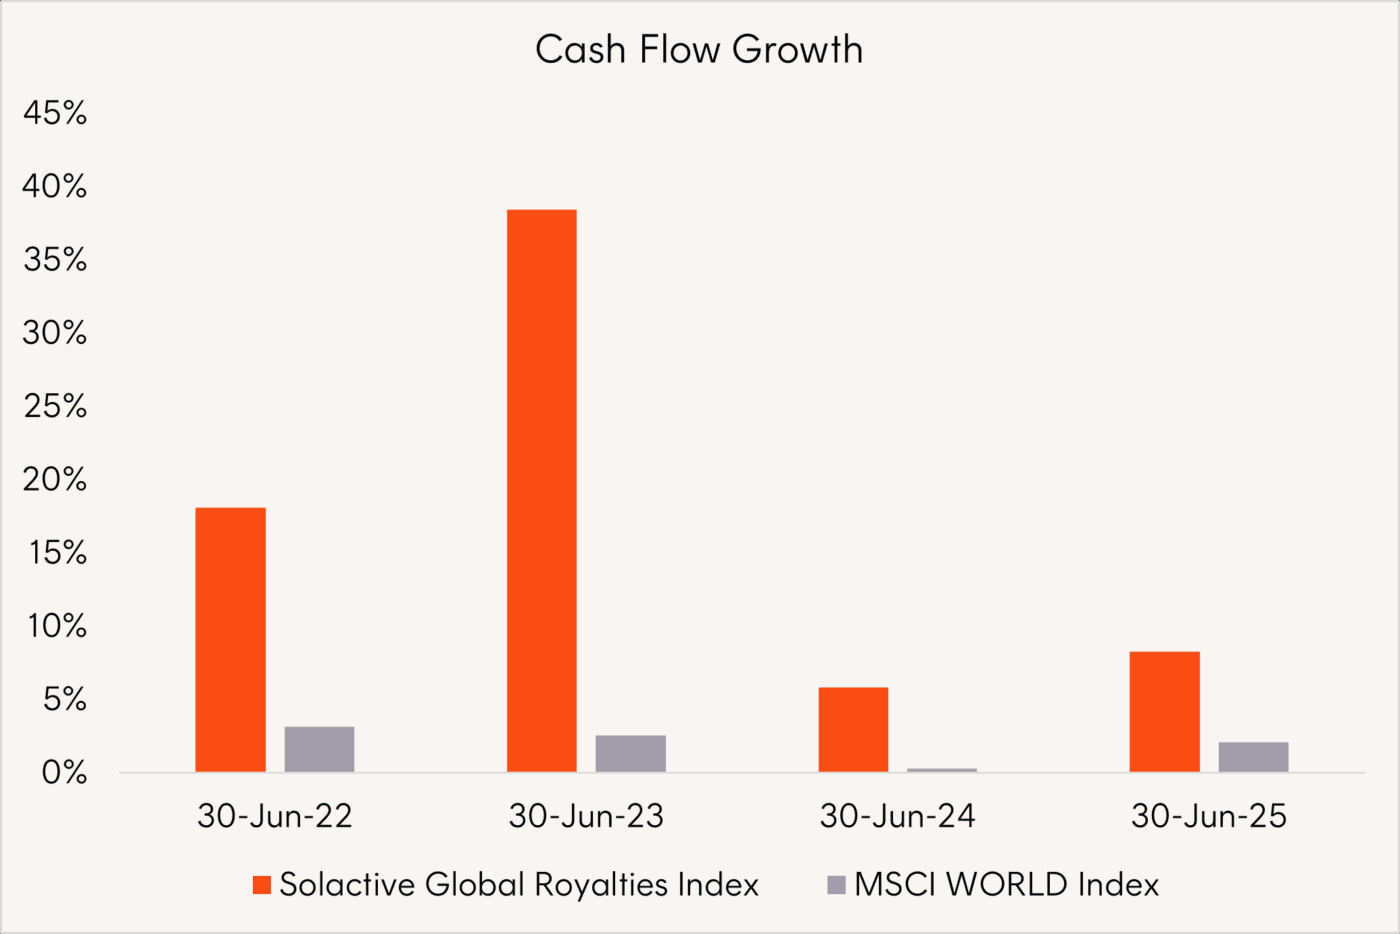
Source: Bloomberg. 30 June 2022 to 30 June 2025.
Potential for attractive, differentiated returns compared to traditional asset classes
ROYL’s index has experienced lower correlation with equity and bond benchmarks providing investors with an alternative investment exposure which can potentially improve the risk-adjusted returns when added to a diversified portfolio.
|
Correlation to ROYL’s index: Nov 2018 – Jun 2025 |
|||
|
MSCI World AUD |
ASX200 |
Bloomberg AusBond Composite 0+Yr Index |
Bloomberg Global Agg TR AUD |
|
0.58 |
0.18 |
0.02 |
0.04 |
Source: Bloomberg. November 2018 to June 2025. Correlations are based on daily returns.
This alternative return profile can increase the robustness of portfolios through different market environments, particularly as equity/bond correlations rise (highlighted by shaded blue areas below) and traditional fixed income exposures potentially become less effective at hedging market downside risk. ROYL’s index has exhibited rising excess returns relative to global equities during these periods.
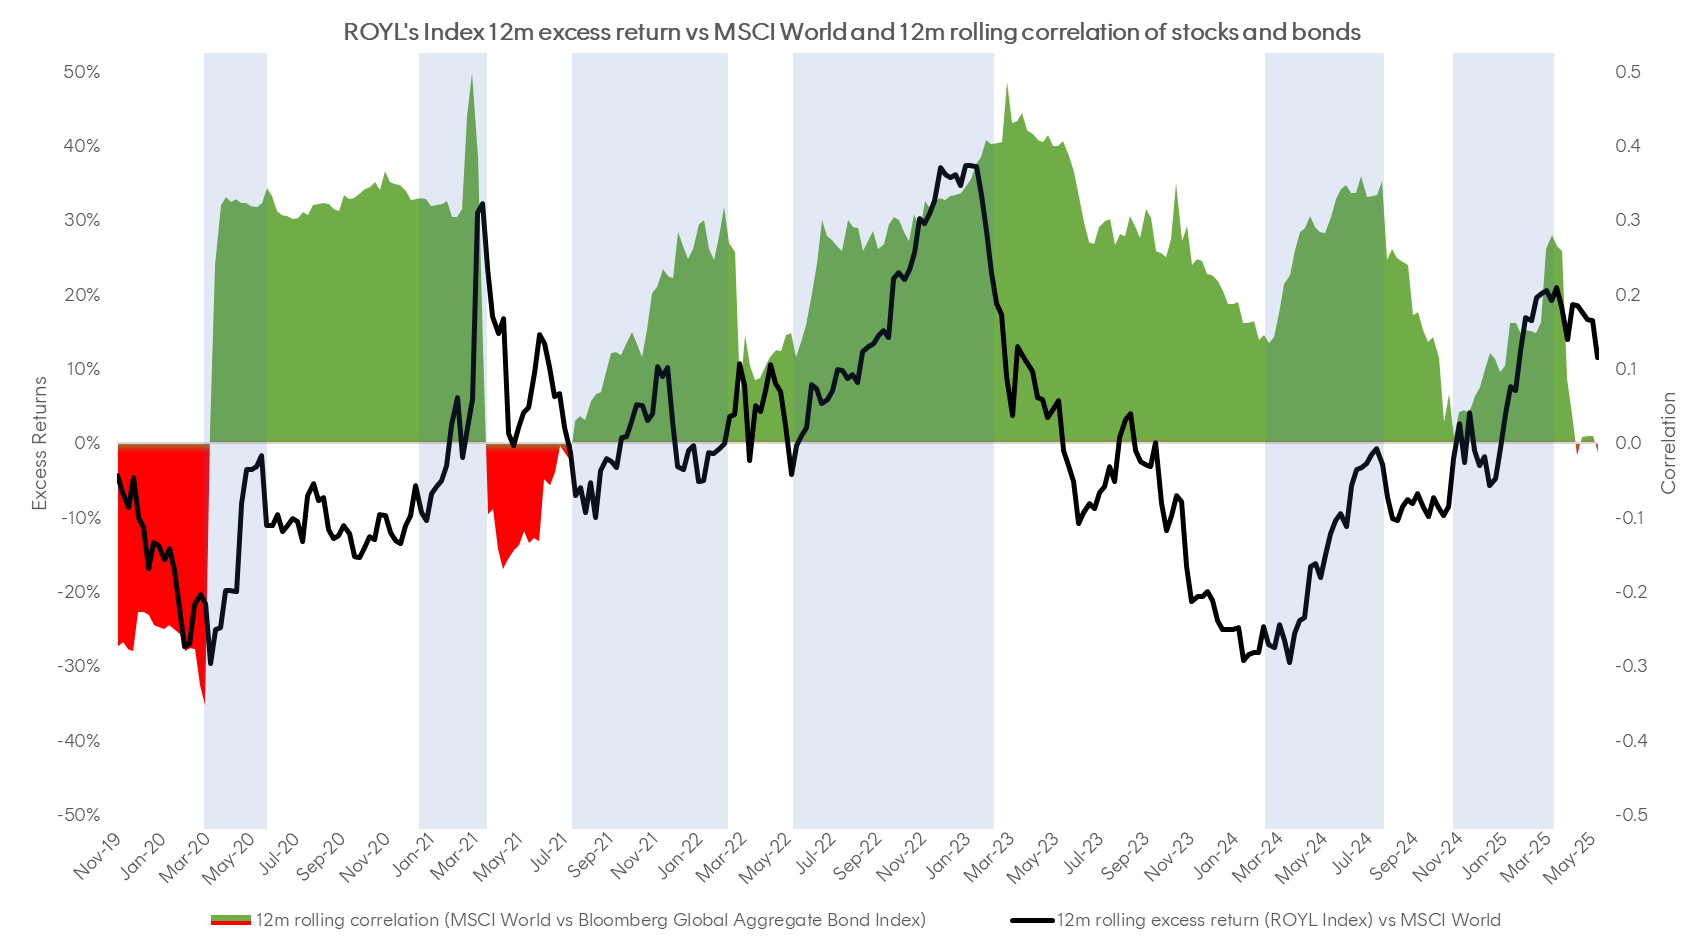
Source: Bloomberg. From November 2018 to June 2025.
As well as providing diversification, ROYL’s unique investment characteristics have delivered attractive returns, both on an absolute and risk-adjusted basis, when added to a portfolio of Australian shares or global shares.
Since fund inception (9 Sept 2022), ROYL has returned 18.43% p.a. after fees and has outperformed both the S&P/ASX200 and MSCI World Indexes across almost all time frames.
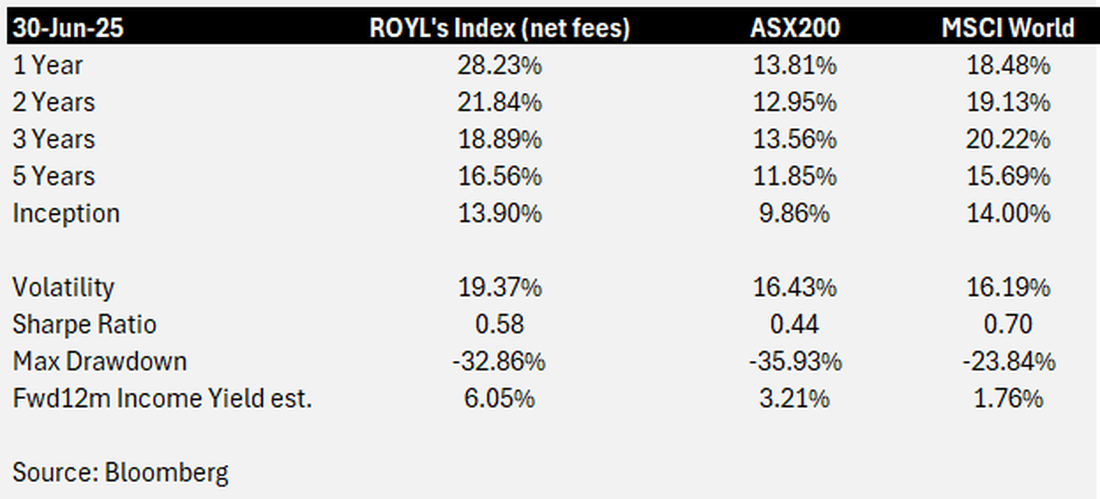
Source: Bloomberg, as at 30 June 2025. Past performance is not indicative of future returns. ROYL’s index inception date was 7 November 2018.
To illustrate the impact of adding royalty companies to a portfolio of Australian shares, we consider a hypothetical scenario in which a 20% allocation to royalty companies (represented by ROYL’s index, net of ROYL’s management fees and costs) is combined with an 80% allocation to Australian shares (represented by the S&P/ASX 200).
Using the period since ROYL’s index inception on 7 November 2018 through to 30 June 2025 demonstrates that relative to Australian equities alone:
- Total returns would have improved from 9.86% to 10.88%
- Volatility would have reduced from 16.43% to 14.41%
- Sharpe ratio would have increased from 0.44 to 0.57
- While the current forward 12m expected income yield would increase from 3.21% to 3.78%
A similar hypothetical exercise can be done by adding a 20% allocation to royalty companies (represented by ROLY’s index, net of management fees and costs) to a portfolio of global shares (represented by the MSCI World Index) using the period since ROYL’s index inception on 7 November 2018 through to 30 June 2025 with the following improvements to broad global equities alone:
- Total returns would have improved from 14% p.a. to 14.22% p.a.
- Volatility would have reduced from 16.19% to 15.55%
- Sharpe ratio would have increased from 0.70 to 0.75
- While the current forward 12m expected income yield would increase from 1.76% to 2.6%
How can you gain access to royalty streams?
Traditionally, royalty investments were opaque and within the domain of private capital and sophisticated investors who were attracted to their high cash flows, low operational risk and upside participation in the growth of the underlying businesses.
Launched in 2022, ROYL was the world’s first ETF to offer a strategy focused purely on royalty companies.
ROYL, provides investors with a liquid and listed exposure to pure play global royalty companies spanning multiple sectors including mining, energy, pharmaceuticals and technology. The fund opens access to this unique opportunity to every investor and can also be used as a liquid complement to direct private royalty exposures.
ROYL pays out smoothed monthly distributions to investors that aim to reflect the 12-month trailing cash flow yield of the underlying companies in ROYL. The prior 12-month cash flow yield of ROYL’s portfolio was 6.05% p.a. (30 June 2025) and this level can be expected to be paid out monthly equating to approximately 0.50% per month as at 31 July 2025.
Footnotes:
1. Earnings before interest, taxes, depreciation and amortisation ↑