You never know what might come along and blindside you. To that end, today’s Fat Tail Daily will look at a potential weak point for the global economy…
Yesterday we chatted about how European banks are hitting new highs. That’s a sign of strength in the important euro economy.
However, we can’t be blasé about anything, either.
In fact, I remember talking to hedge fund legend Jim Rogers once and asking him what he worried about.
He said, “I worry about everything.”
You never know what might come along and blindside you.
To that end, today’s Fat Tail Daily will look at a potential weak point for the global economy…
It’s Chinese real estate.
Now, I know what you’re thinking…
What’s new?
Stay with me.
Back in July, the Financial Times reported that land sales in China’s smaller cities are still going down.
China’s “tier one” cities like Beijing and Shanghai are ok. But they’re the extreme, like London in the UK.
It’s the “tier three” (and below) inland cities that are struggling.
This is a problem for local governments because they rely on land sales to fund their social spending. It also suppresses consumer sentiment and spending.
That’s not all…
I just finished a new book by economist Kenneth Rogoff. He discusses China. He points out that 60% of Chinese output comes from these struggling regions. That’s a high figure.
Another factor Rogoff reveals is that China’s famous real estate overbuilding is mostly in these areas too.
And these cities are also losing people as younger Chinese migrate to more vibrant areas with better job prospects.
This is where the facts get murkier. Local Chinese governments across the country have used financing vehicles that issue debt.
This hidden and obscure debt figure could be as much as 50%, possibly even higher, of Chinese GDP…and it’s linked to real estate prices…that are falling.
In other words, the Chinese economy is sitting on a potential bomb.
You know as well as I that this fear has percolated through the markets for years.
Why would now be any different?
One reason is that Chinese growth is falling away.
That could expose this weakness. Another is the worry we have about America – Chinese central government debt will likely go over 100% of GDP by 2027.
That’s a problem when the country is already too stingy with social spending. That’s why the Chinese save so much.
Advertisement:
The fourth big ‘shift’ in mining
There have been three major changes to the way the resource sector works in the last century.
Each one birthed some of Australia’s biggest mining companies — like BHP, Rio Tinto and Fortescue…and handed some significant gains to investors.
We’re now witnessing a fourth major shift in this sector…
Discover the four stocks that could benefit most here.
The Economist points out that Chinese households save about 30% of their income. They used to put it into property. But that game is not working much these days, so mostly it goes into deposits.
Because that doesn’t generate much return, it doesn’t give them much more spending power to bolster the domestic market.
Hence, we have deflation in China.
We also know that Trump is attacking Chinese exports – an area of recent strength for China.
China could be vulnerable if global trade falls away, or the US economy really does start to weaken considerably.
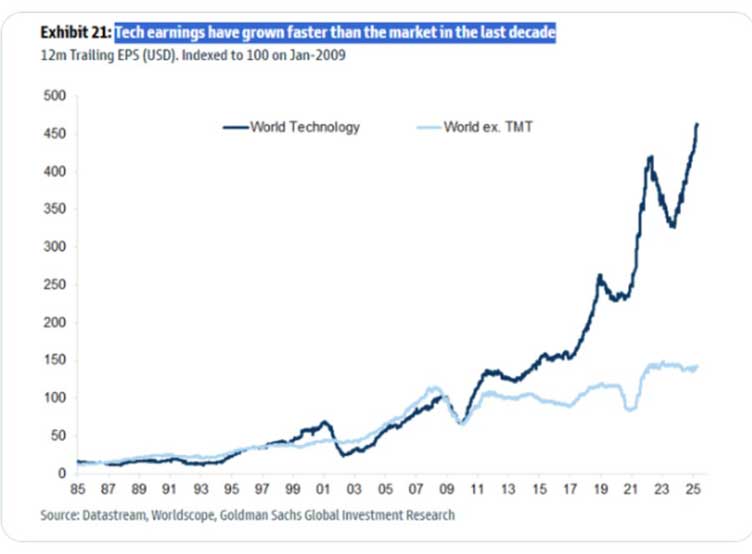
One worry on that front is that a recent chart reveals all the earnings growth driving US markets is only coming from the “Magnificent Seven”.
Check it out…
|
|
|
Source: X |

We know these companies are making an “all in” bet on artificial intelligence.
They will fork out US$300 billion this year on capital spending.
However, already the AI steam train is running into constraints around power – not something that can easily be solved quickly.
It’s not necessarily something to preoccupy yourself with today.
The market is well in the green. The bulls are in charge.
However, it’s pretty clear that the Mag 7 are driving the US economy. Where they go – so go the rest of us, including China, and Australia.

Callum Newman,
Editor, Small-Cap Systems and Australian Small-Cap Investigator
***
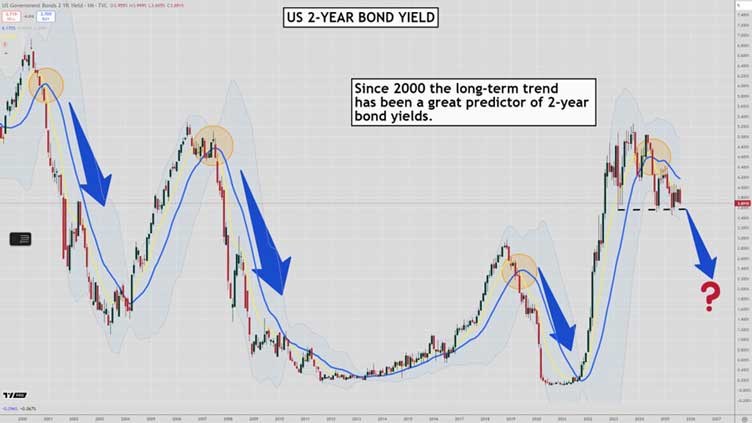
Source: Tradingview.com
[Click to open in a new window]
The last couple of years has seen plenty of confusion about the future path of interest rates in the US.
After the inflation scare, and then the relief that inflation was under control, tariffs, growth, and Trump have seen the US Fed pause interest rate changes while waiting to see more data.
That time of restraint may be over after the terrible unemployment figures released last Friday.
2-year bond yields fell dramatically on the day, and the bird’s eye view of the chart hints that more falls in interest rates may be coming soon.
The above chart shows you a monthly chart of the 2-year bond yield (remember prices move inversely to yields).
The crossover of the 10-month EMA and the 20-month SMA has been fabulous at predicting the path of interest rates for decades.
I have circled every time the long-term trend turned down in the past couple of decades above.
The long-term trend turned down in August last year. But since then confusion has reigned and interest rates have been gyrating wildly.
But the downtrend remains, and 2-year interest rates have found stiff resistance at the 20-month moving average.
After the large fall last week, the support level at 3.60% has come into view (the dashed line), and my guess is the next test of that level could see 2-year interest rates starting to trend down sharply again.
Perhaps the bad employment figures will spark a stock rally as expectations of falling interest go through the roof.
Regards,

Murray Dawes,
Editor, Retirement Trader

All advice is general advice and has not taken into account your personal circumstances.
Please seek independent financial advice regarding your own situation, or if in doubt about the suitability of an investment.